pandas 的主要数据结构#
Series 对象#
一种类似一维数组的对象
由一组数据以及一组与之相关的数据标签(即索引)组成
可以存储任何类型的数据
1
2
3
4
| 0 Python
1 Java
2 C++
索引 数据
|
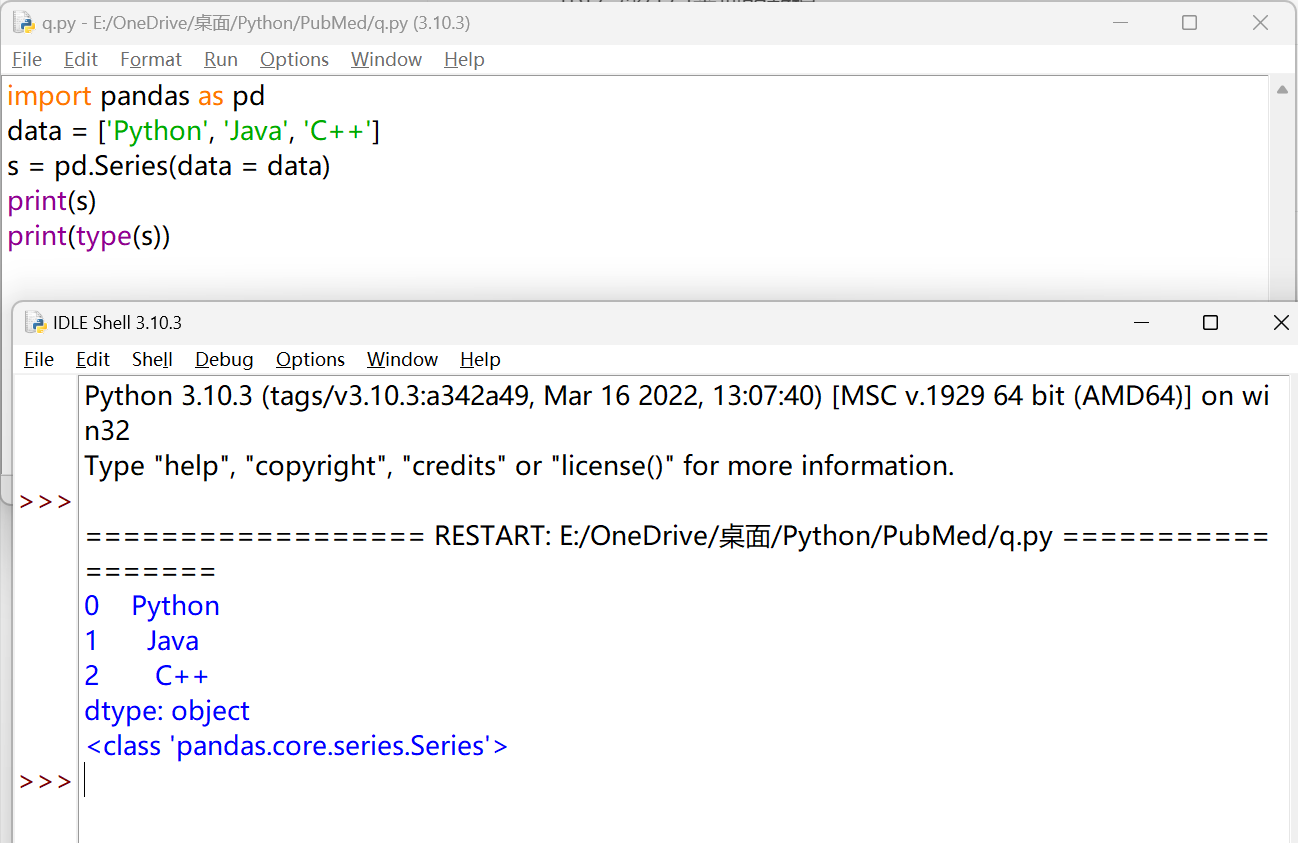
创建 Series 对象#
Pandas使用Series()函数来创建Series对象,通过这个对象可以调用相应的方法和属性,从而达到处理数据的目的。
1
2
3
4
5
| import pandas as pd
data = ['Python', 'Java', 'C++']
s = pd.Series(data = data)
print(s)
print(type(s))
|
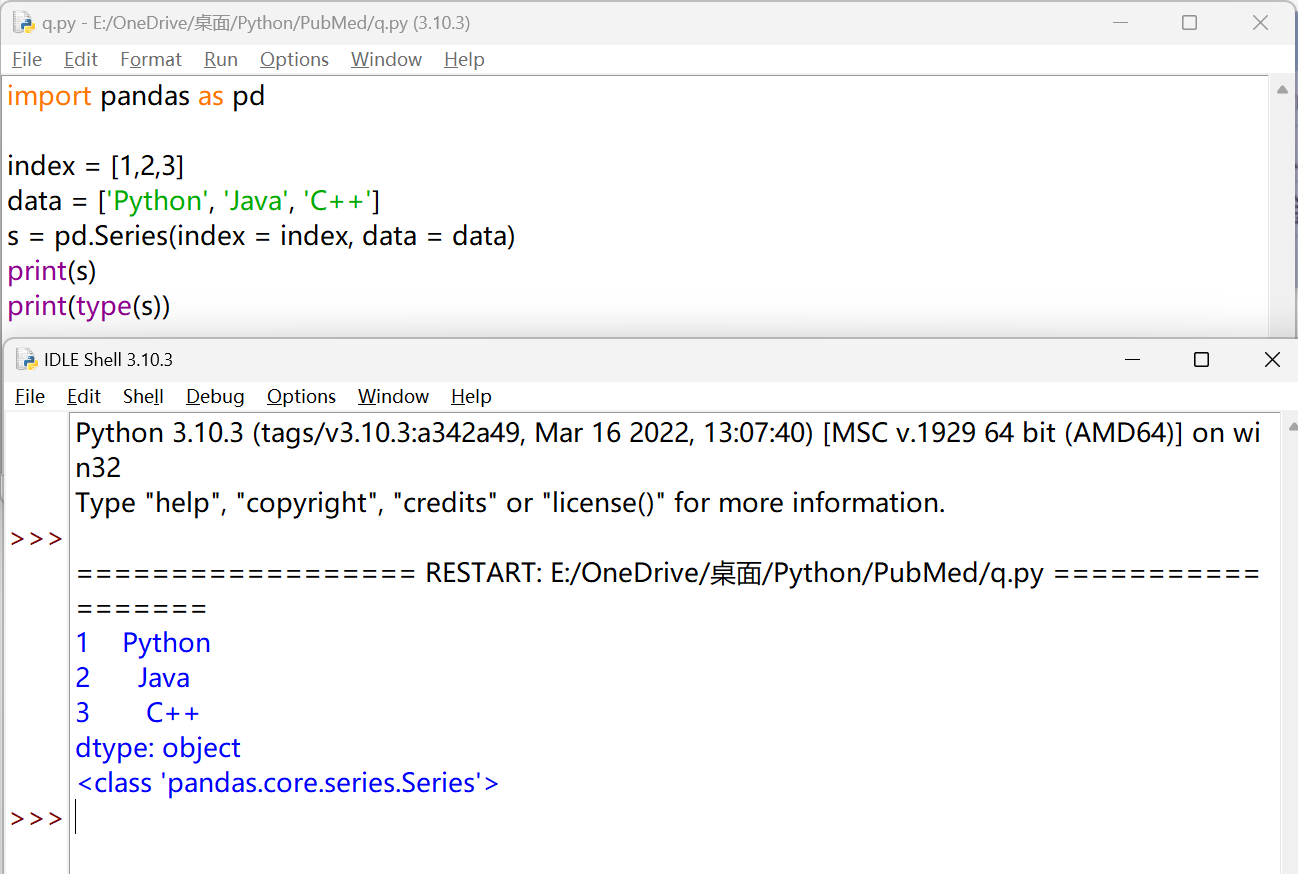
1
2
3
4
5
6
7
| import pandas as pd
index = [1,2,3]
data = ['Python', 'Java', 'C++']
s = pd.Series(index = index, data = data)
print(s)
print(type(s))
|
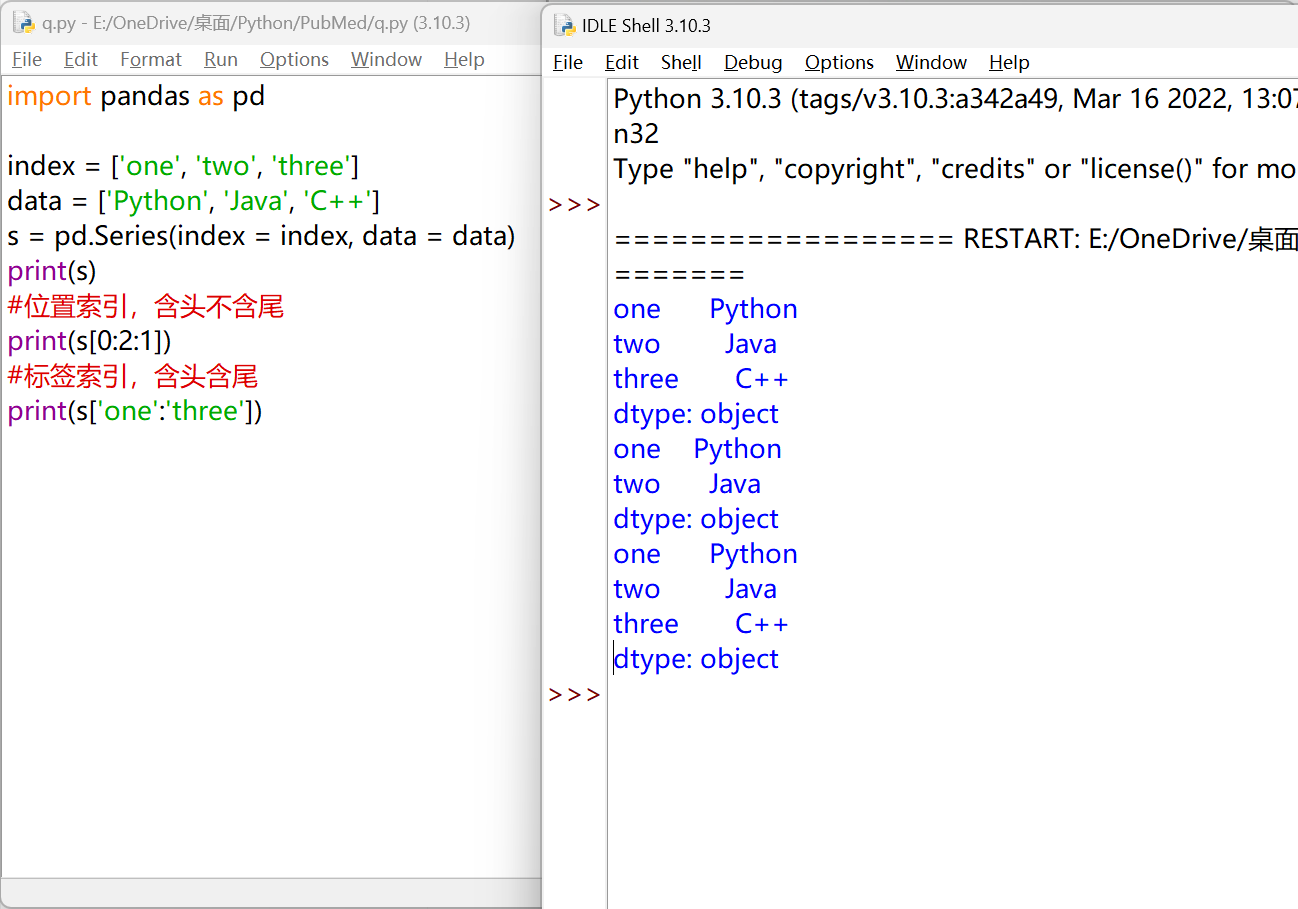
访问 Series 对象#
 1
 2
 3
 4
 5
 6
 7
 8
 9
10
| import pandas as pd
index = ['one', 'two', 'three']
data = ['Python', 'Java', 'C++']
s = pd.Series(index = index, data = data)
print(s)
#位置索引,含头不含尾
print(s[0:2:1])
#标签索引,含头含尾
print(s['one':'three'])
|
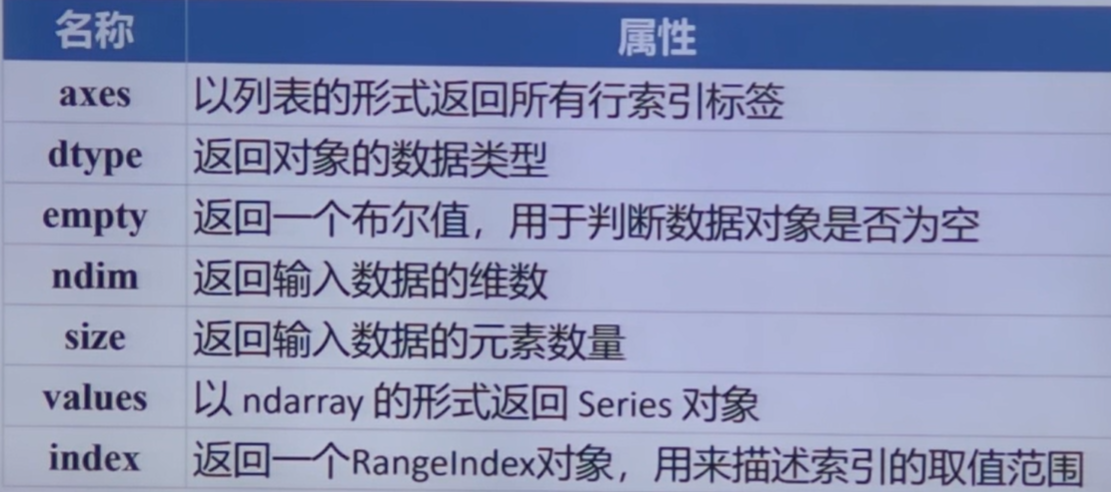
Series 的常用属性#
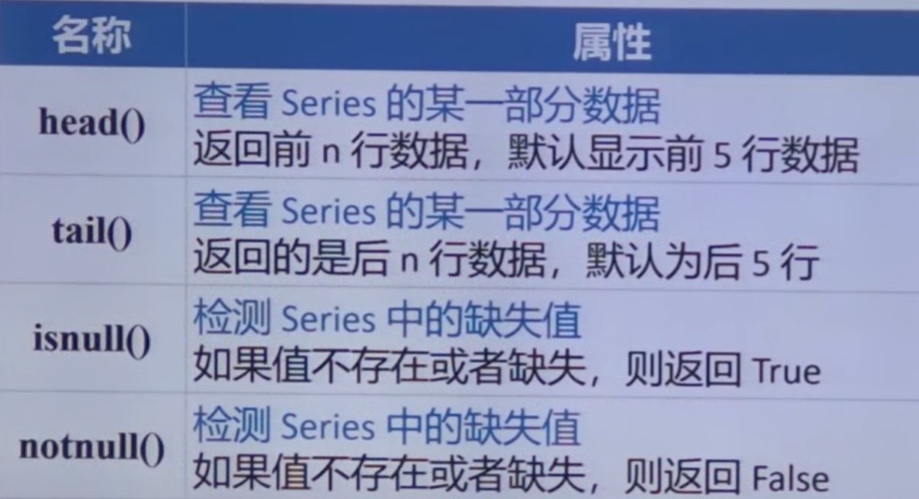
Series 的常用方法#
DataFrame 对象#
https://pandas.pydata.org/docs/reference/api/pandas.DataFrame.html#pandas.DataFrame
一种表格型数据结构(行标签 index,列标签 columns)
异构数据表:表格中每列的数据类型可以不同
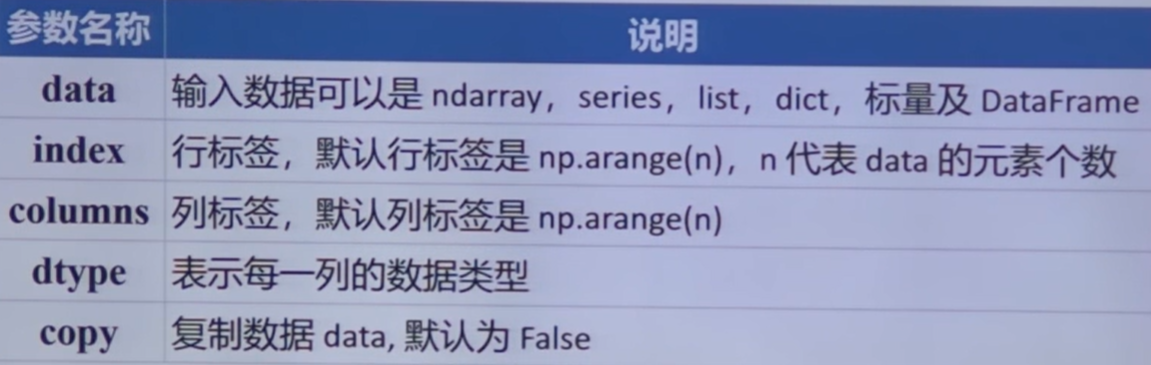
创建 DataFrame 对象
pd.DateFrame(data, index, columns, dtype)
由 Series 演变而来,每一行或列数据都可以看成一个 Series 结构
创建 DataFrame 对象#
pd.DataFrame(data, index, columns, dtype)
用列表创建#
 1
 2
 3
 4
 5
 6
 7
 8
 9
10
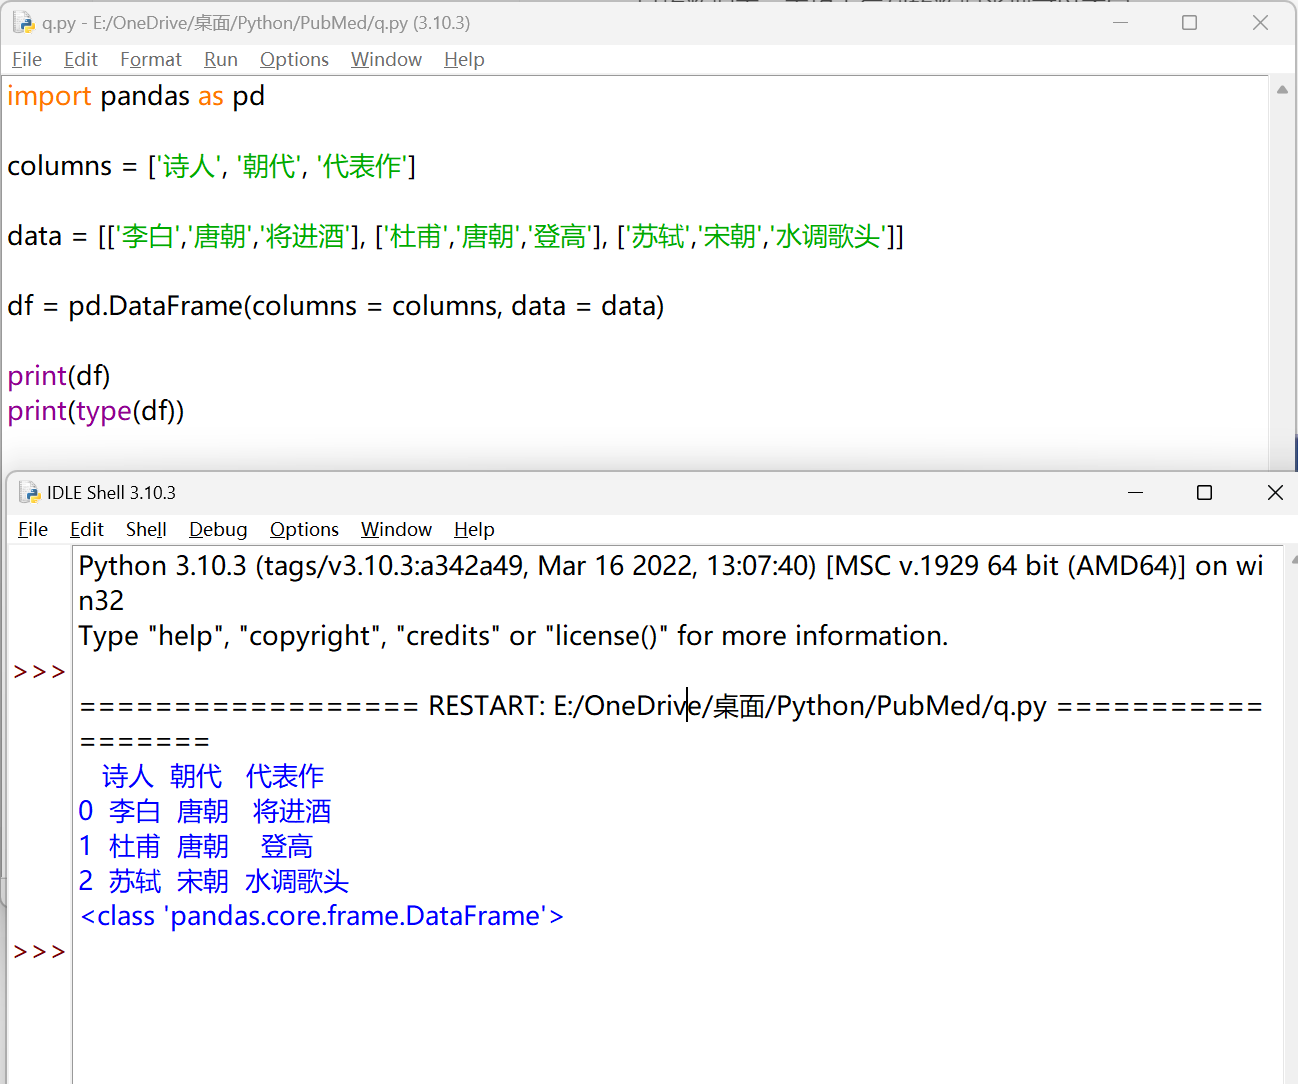
| import pandas as pd
columns = ['诗人', '朝代', '代表作']
data = [['李白','唐朝','将进酒'], ['杜甫','唐朝','登高'], ['苏轼','宋朝','水调歌头']]
df = pd.DataFrame(columns = columns, data = data)
print(df)
print(type(df))
|
用字典嵌套列表创建#
键对应的元素长度必须相同
1
2
3
4
5
6
7
8
9
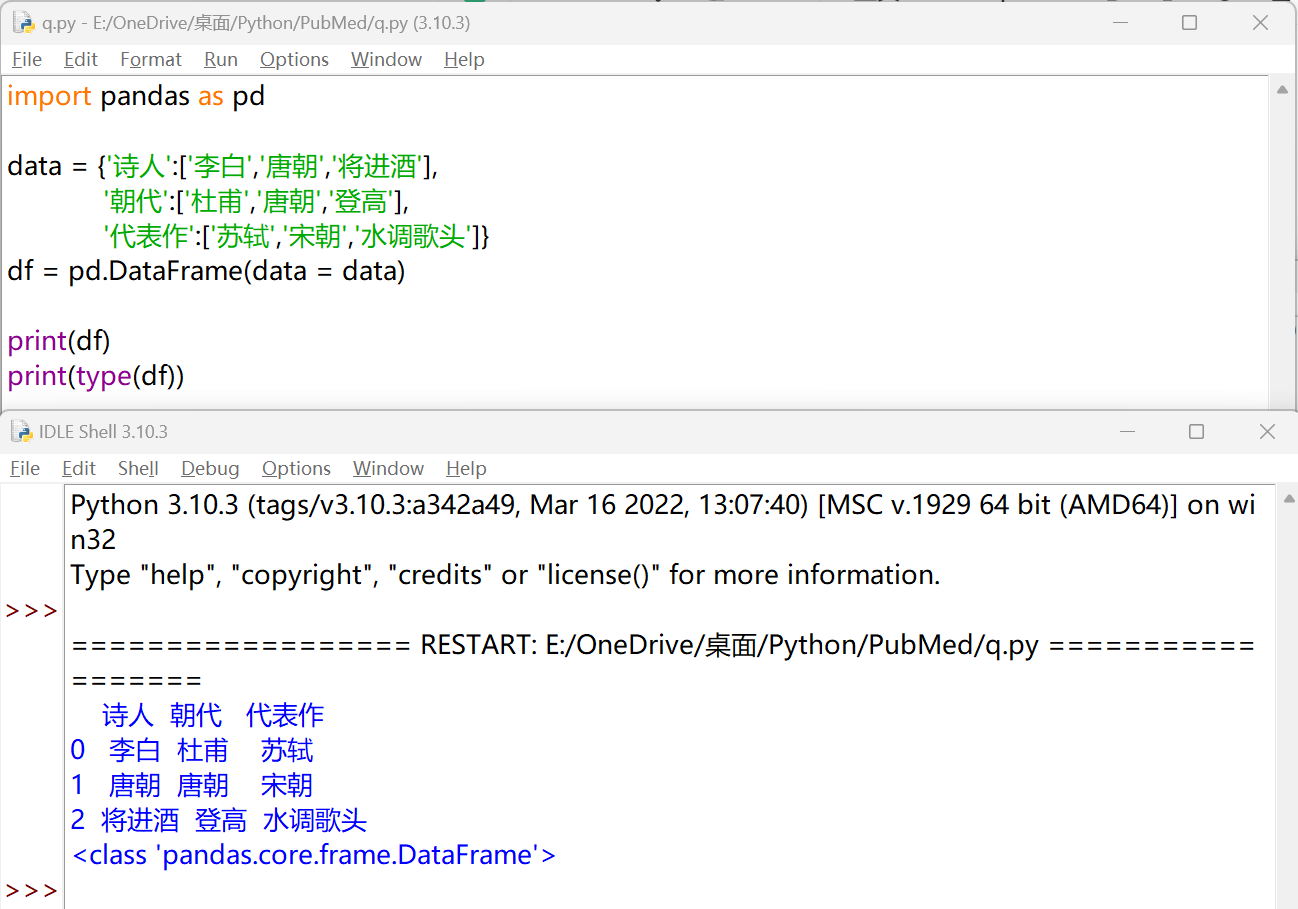
| import pandas as pd
data = {'诗人':['李白','唐朝','将进酒'],
'朝代':['杜甫','唐朝','登高'],
'代表作':['苏轼','宋朝','水调歌头']}
df = pd.DataFrame(data = data)
print(df)
print(type(df))
|
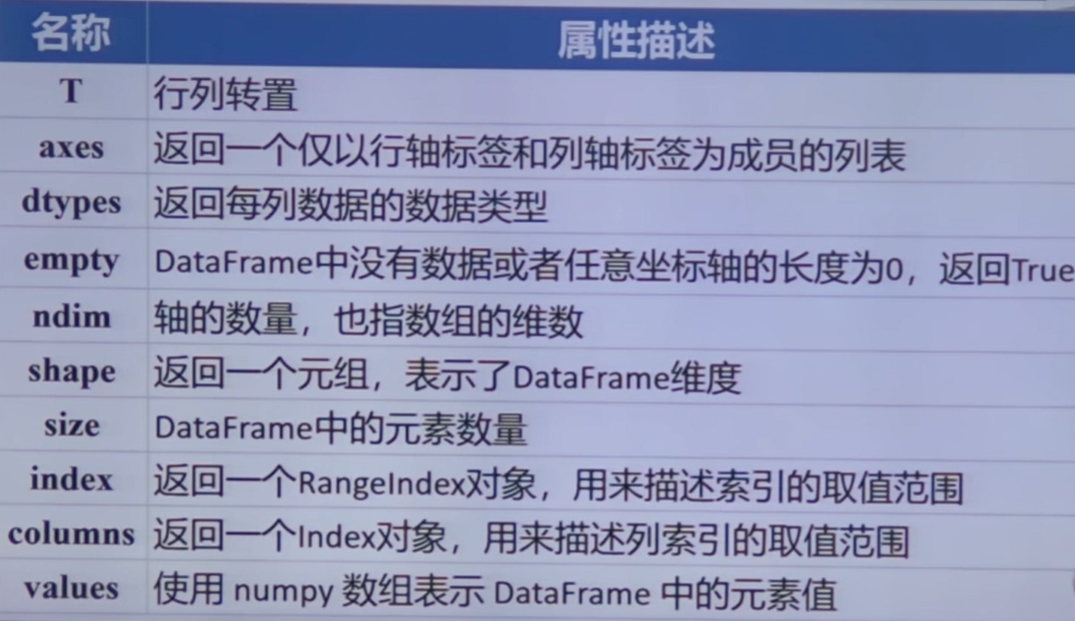
DataFrame 的常用属性#
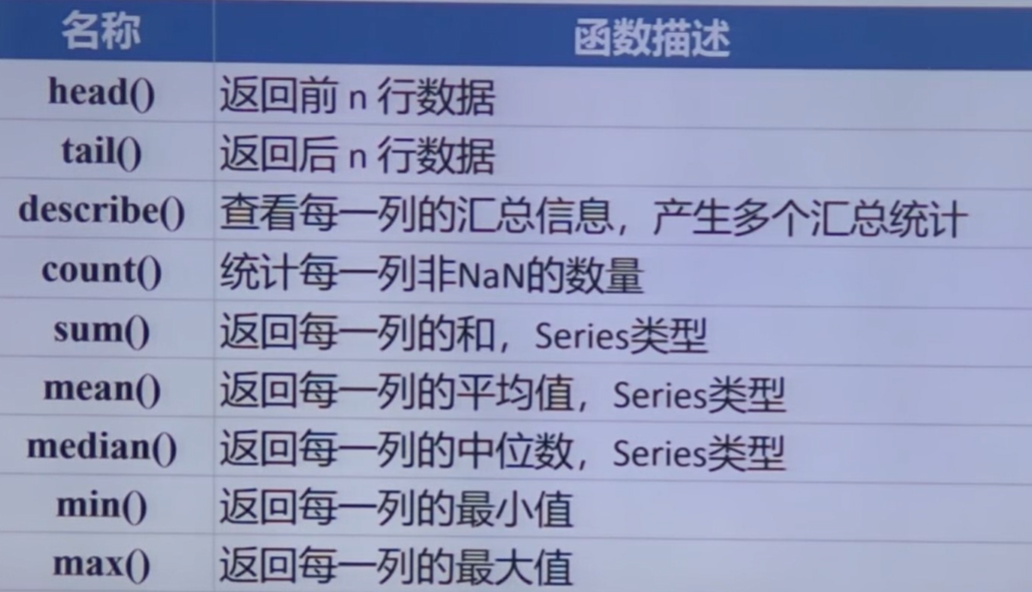
DataFrame 重要函数#
pandas 导入外部数据#
https://pandas.pydata.org/docs/reference/io.html
pandas可以对多种类型的数据进行读写操作,包括:Excel、CSV、HTML、JSON、Latex、SQL、SPSS、SAS、STATA、ORC、Feather、Parquet等文件类型
pd.read_X()
pd.DataFrame.to_X()
导入 Excel 数据#
.xls``.xlsx文件
pd.read_excel(io, sheet_name, header, index_col, usecols)

1
2
3
4
| import pandas as pd
df = pd.read_excel('PubMed文献信息.xlsx')
print(df)
|
导入 CSV 数据#
Comma-Separated Values
pd.read_csv(io, sep=',', encoding, index_col, usecols)

导出数据#
pd.DataFrame.to_excel()
pd.DataFrame.to_csv()
pd.DataFrame.to_excel(excel_writer, sheet_name, index)

1
2
3
4
5
6
7
8
9
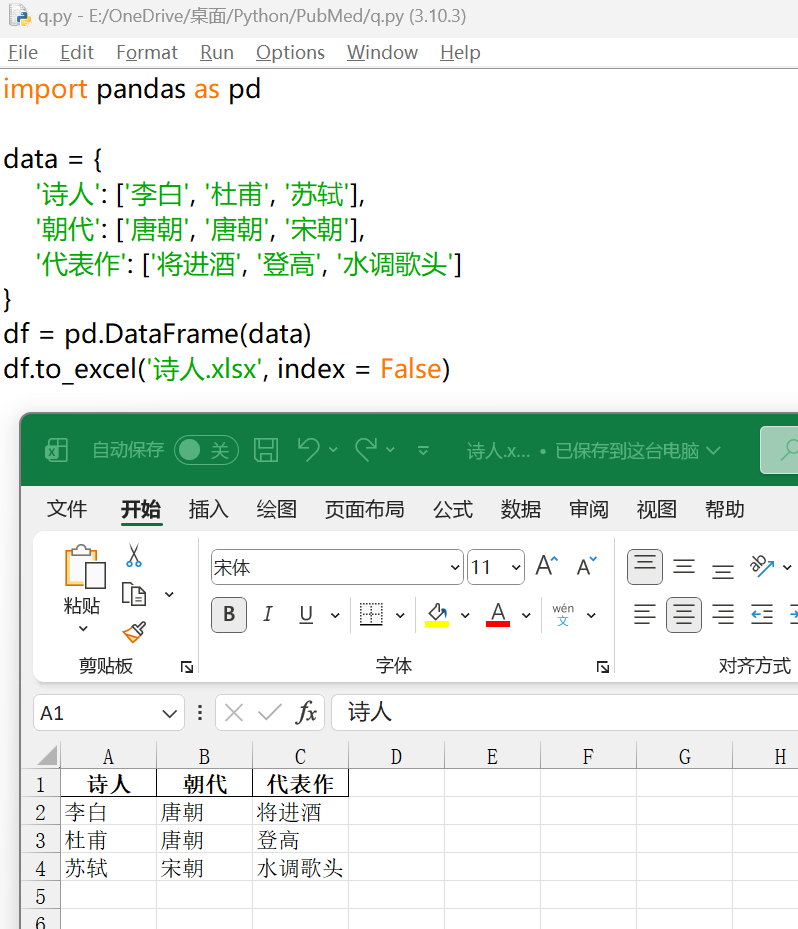
| import pandas as pd
data = {
'诗人': ['李白', '杜甫', '苏轼'],
'朝代': ['唐朝', '唐朝', '宋朝'],
'代表作': ['将进酒', '登高', '水调歌头']
}
df = pd.DataFrame(data)
df.to_excel('诗人.xlsx', index = False)
|
 1
 2
 3
 4
 5
 6
 7
 8
 9
10
11
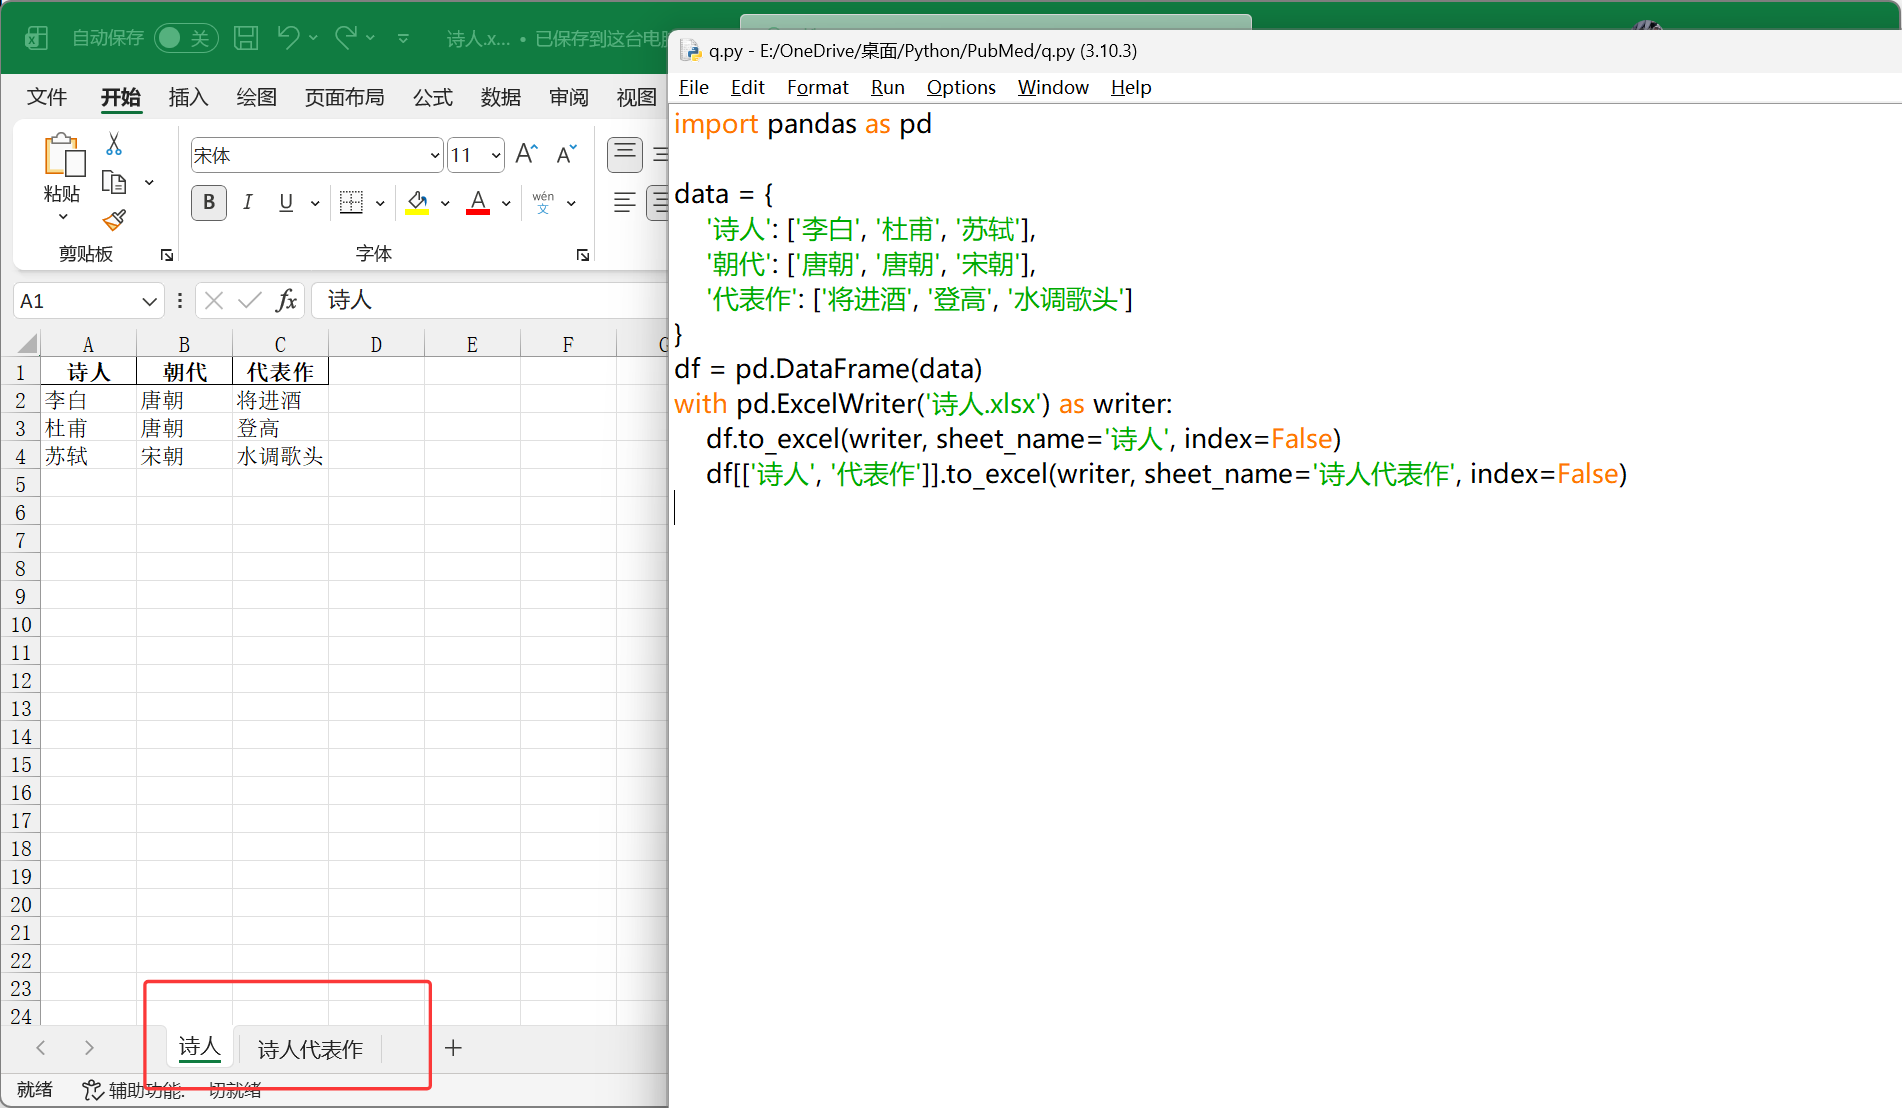
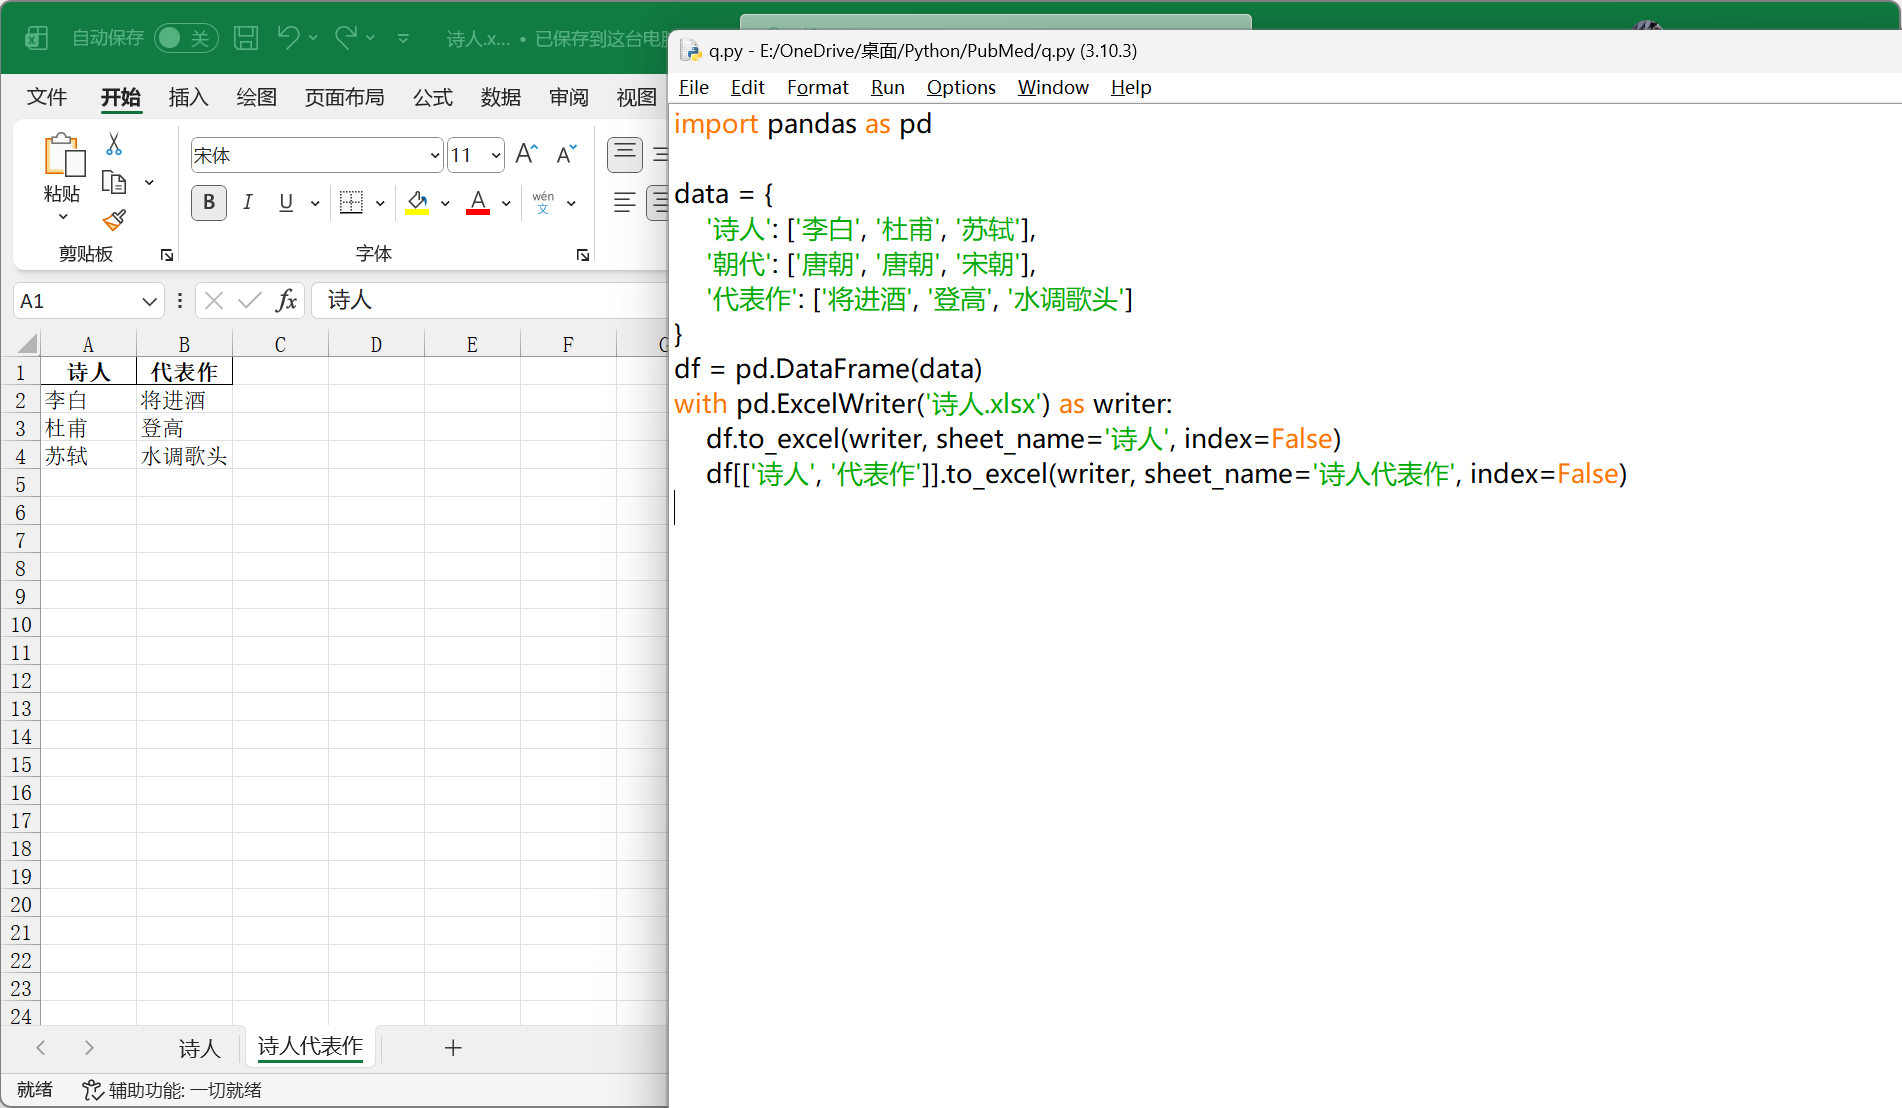
| import pandas as pd
data = {
'诗人': ['李白', '杜甫', '苏轼'],
'朝代': ['唐朝', '唐朝', '宋朝'],
'代表作': ['将进酒', '登高', '水调歌头']
}
df = pd.DataFrame(data)
with pd.ExcelWriter('诗人.xlsx') as writer:
df.to_excel(writer, sheet_name='诗人', index=False)
df[['诗人', '代表作']].to_excel(writer, sheet_name='诗人代表作', index=False)
|
pandas 数据清洗#
https://data.stats.gov.cn/easyquery.htm?cn=C01
发现 2022 -2025 并没有更新,所以用到的数据是 2021 年及之前 20 年的数据。

原始数据分析#
表头、空值、表尾等,要根据实际情况处理调整原始数据
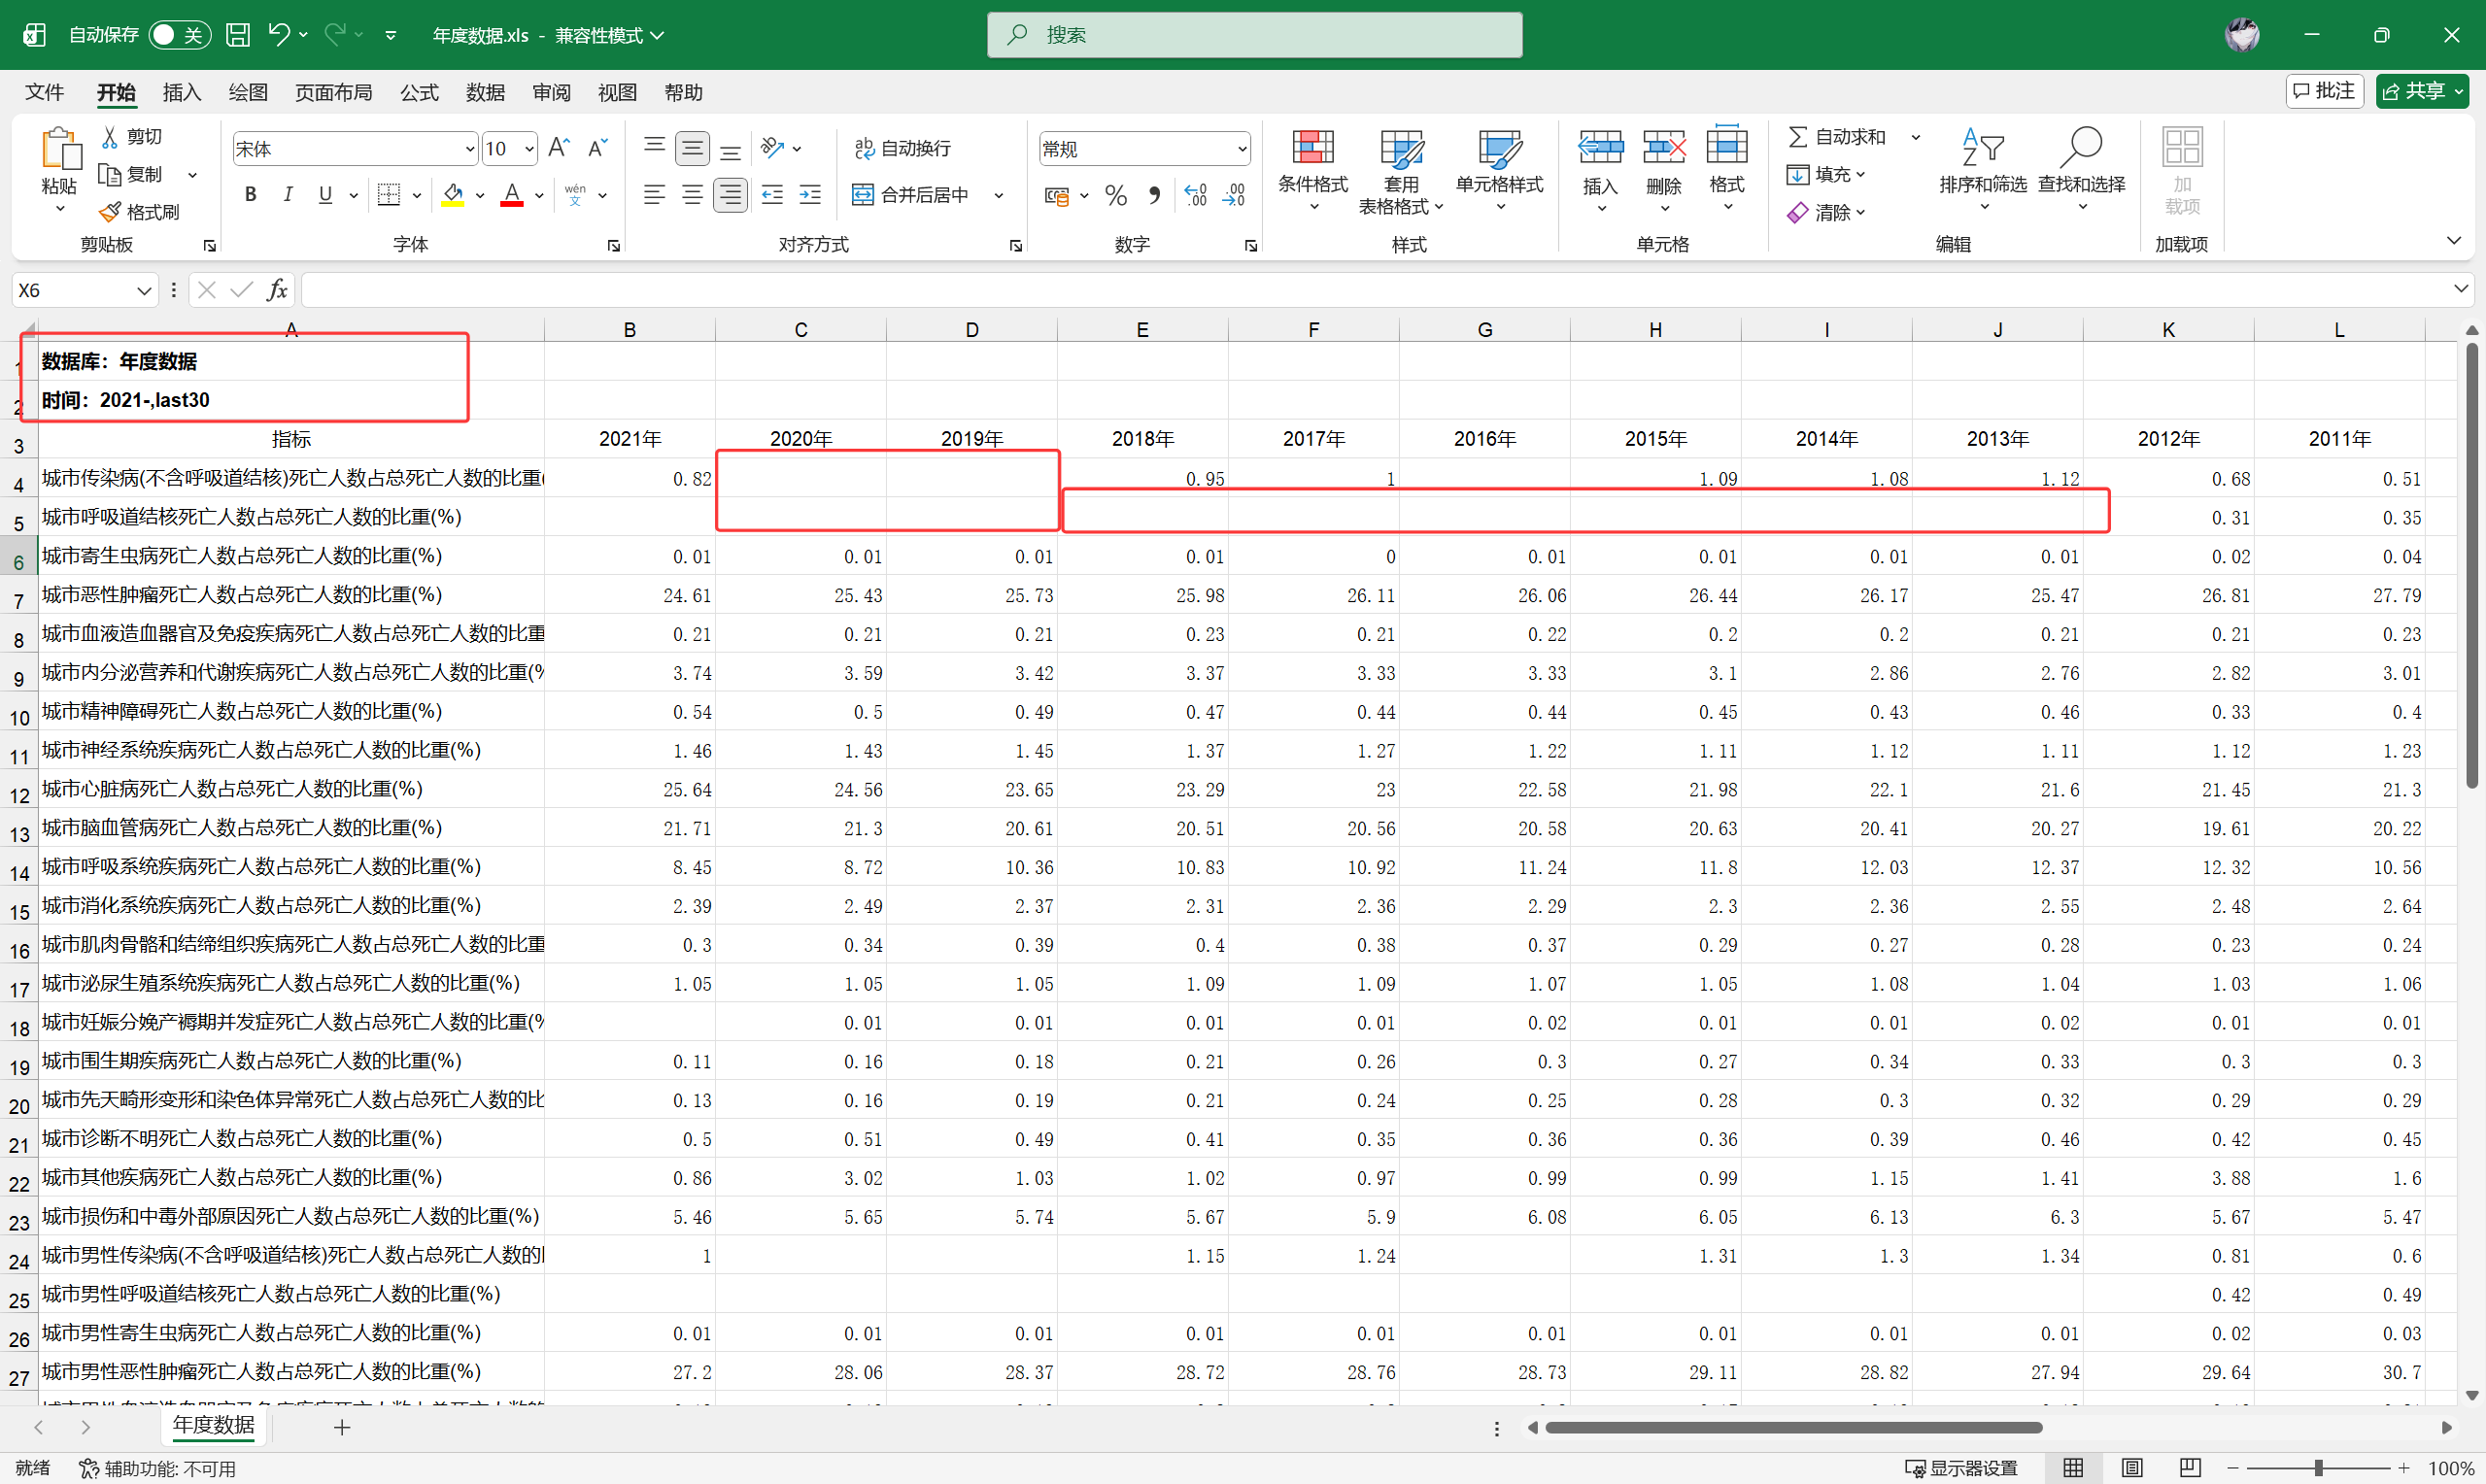

整体思路:
提取有效数据,去头、去尾
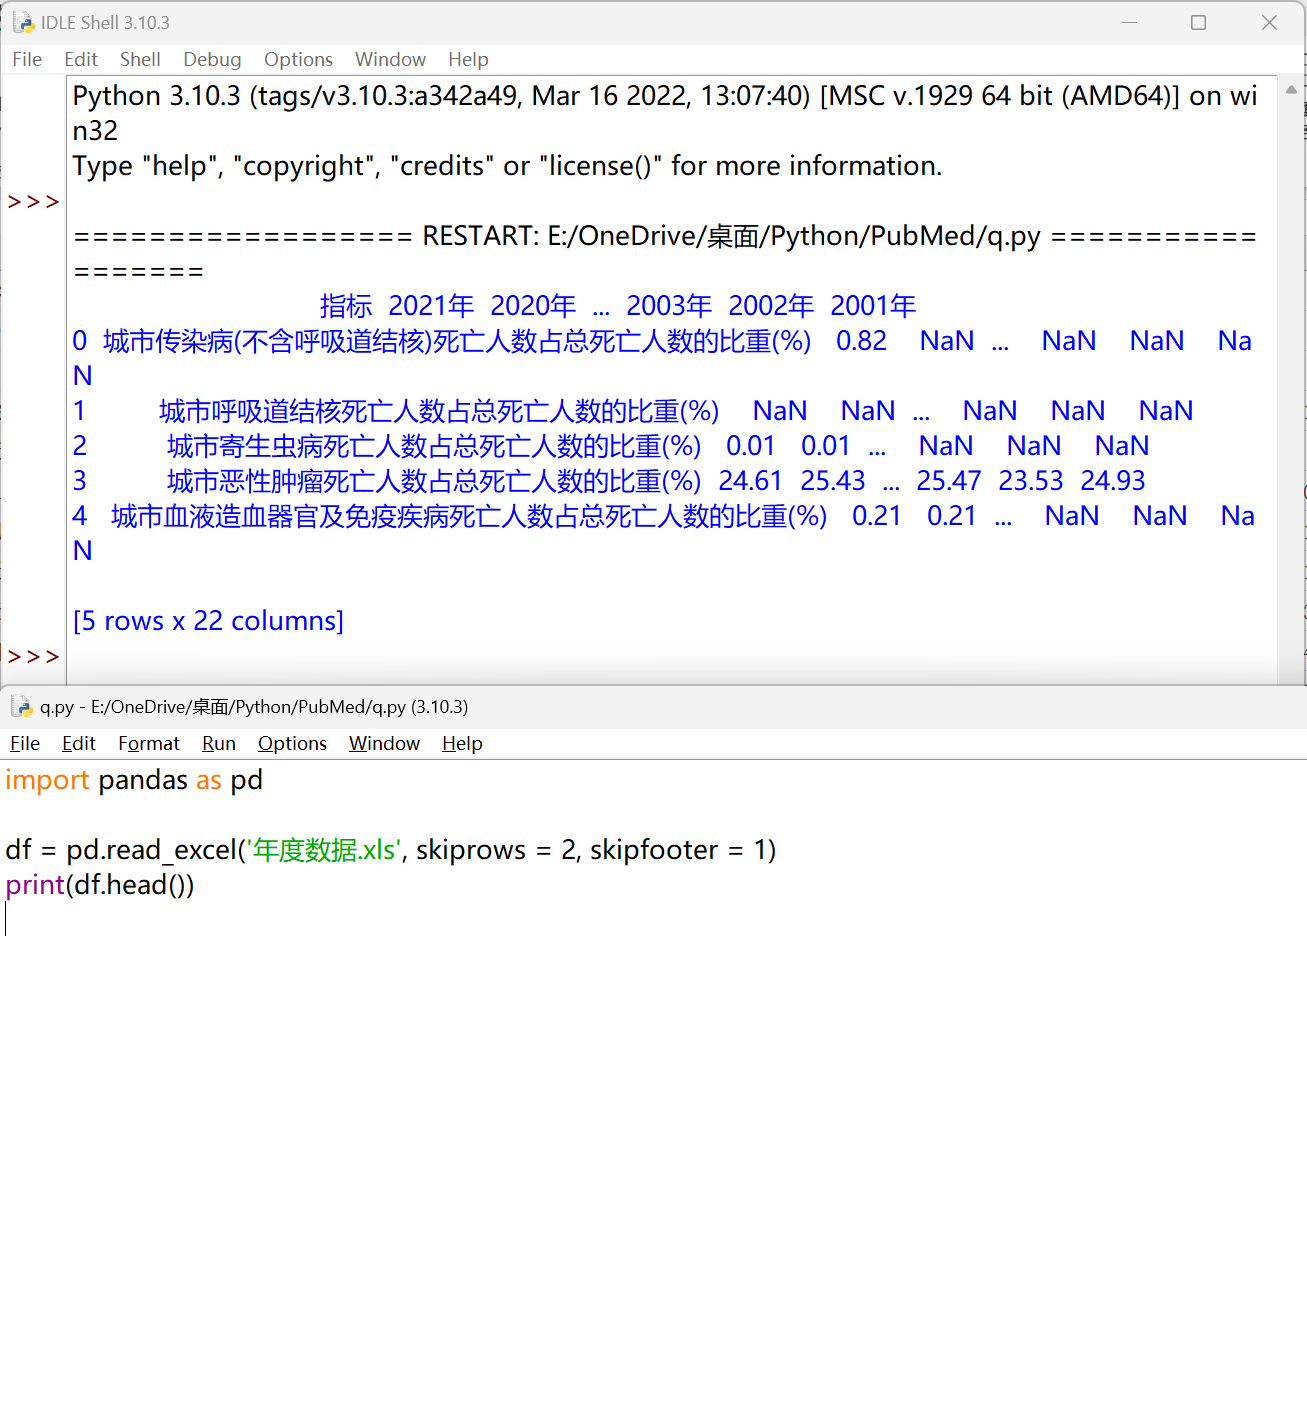
使用 apply() 方法对每个指标名称进行处理#
1
2
3
4
| import pandas as pd
df = pd.read_excel('年度数据.xls', skiprows = 2, skipfooter = 1)
print(df.head())
|
1
2
3
4
5
6
7
8
| import pandas as pd
df = pd.read_excel('年度数据.xls', skiprows = 2, skipfooter = 1)
#print(df.head())
df['指标'] = df['指标'].apply(lambda s:s[2:-len('死亡人数占总死亡人数的比重(%)')])
print(df['指标'])
|
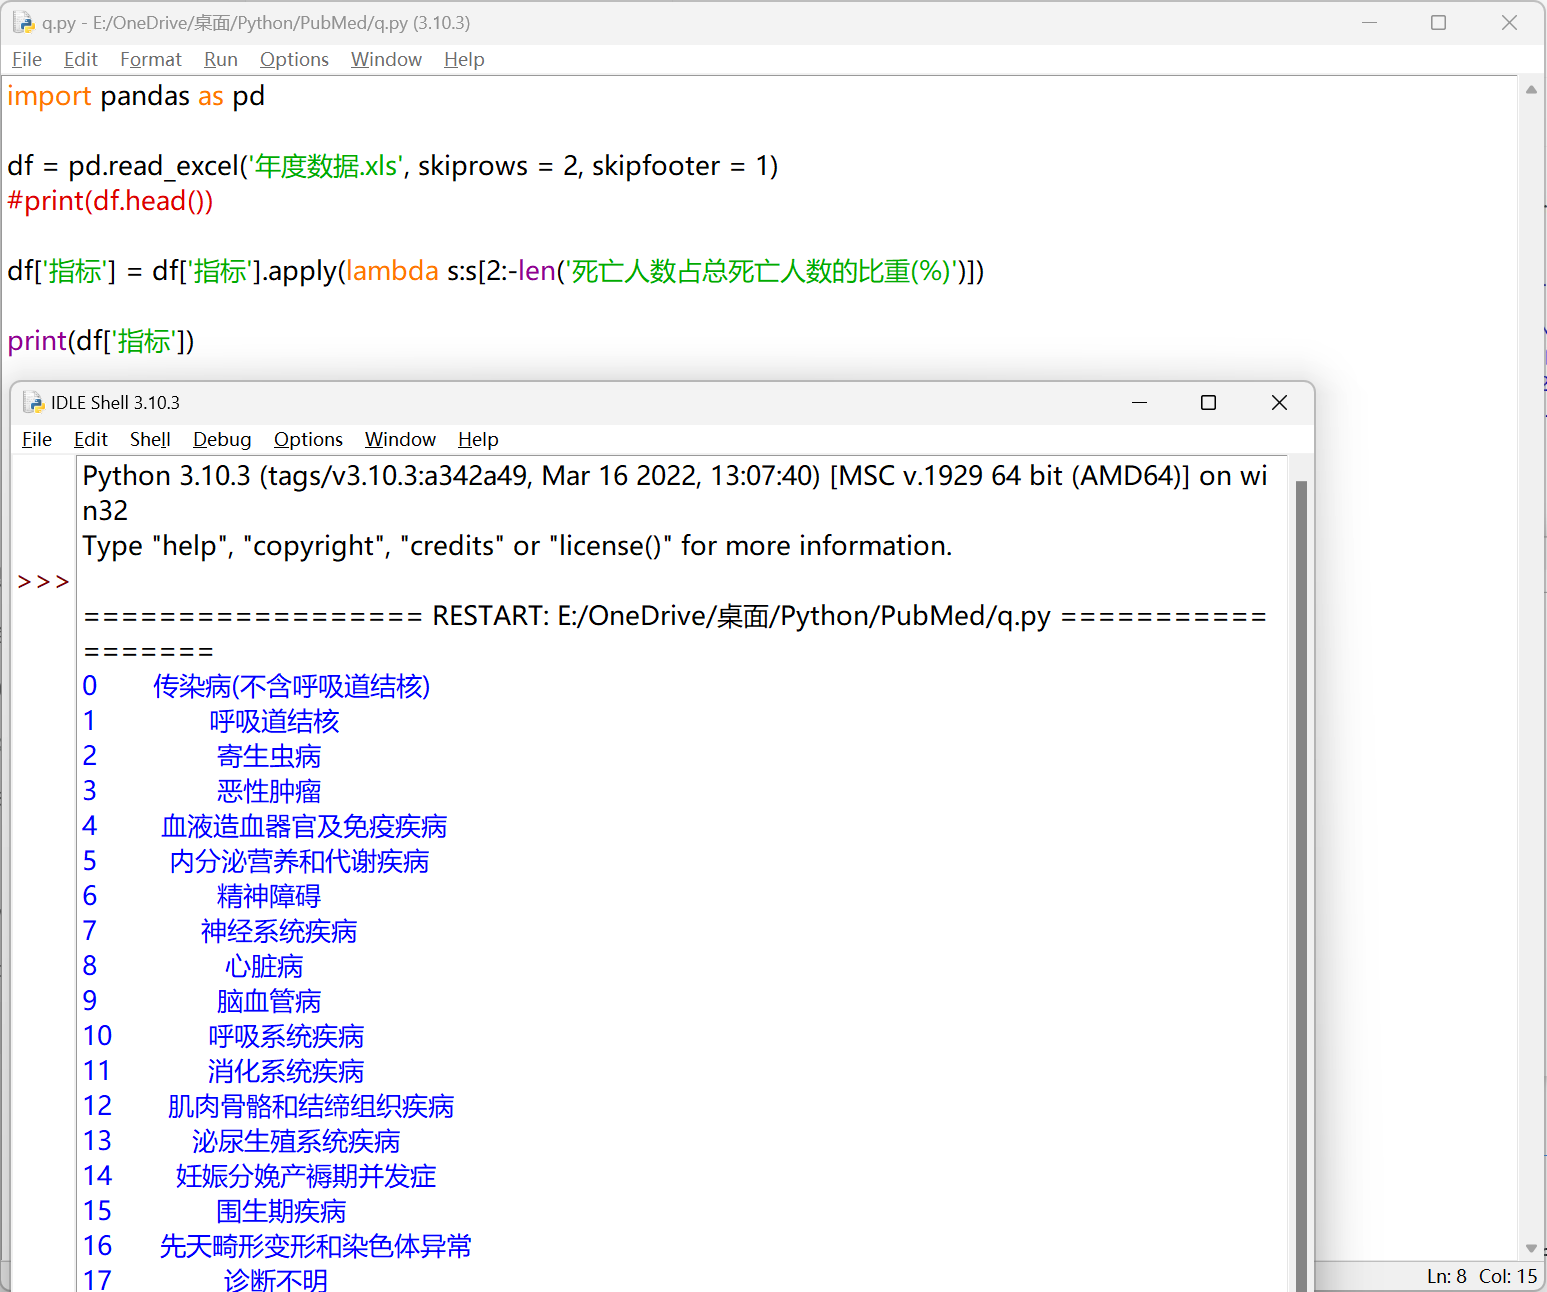
dropna 删除空值 & fillna 填充空值#
df.dropna(axis, how, thresh, inplace)
 1
 2
 3
 4
 5
 6
 7
 8
 9
10
11
12
13
14
15
| import pandas as pd
df = pd.read_excel('年度数据.xls', skiprows = 2, skipfooter = 1)
#处理指标数据
df['指标'] = df['指标'].apply(lambda s:s[2:-len('死亡人数占总死亡人数的比重(%)')])
#去除分男女数据
df = df.iloc[:20,:]
#处理空值
df = df.dropna(axis = 1, how = 'all')
#根据需求设置'指标'列为行名
df.set_index('指标', inplace = True)
#填充空值
df = df.apply(lambda x:x.fillna(x.mean()), axis = 1)
print(df.head())
|
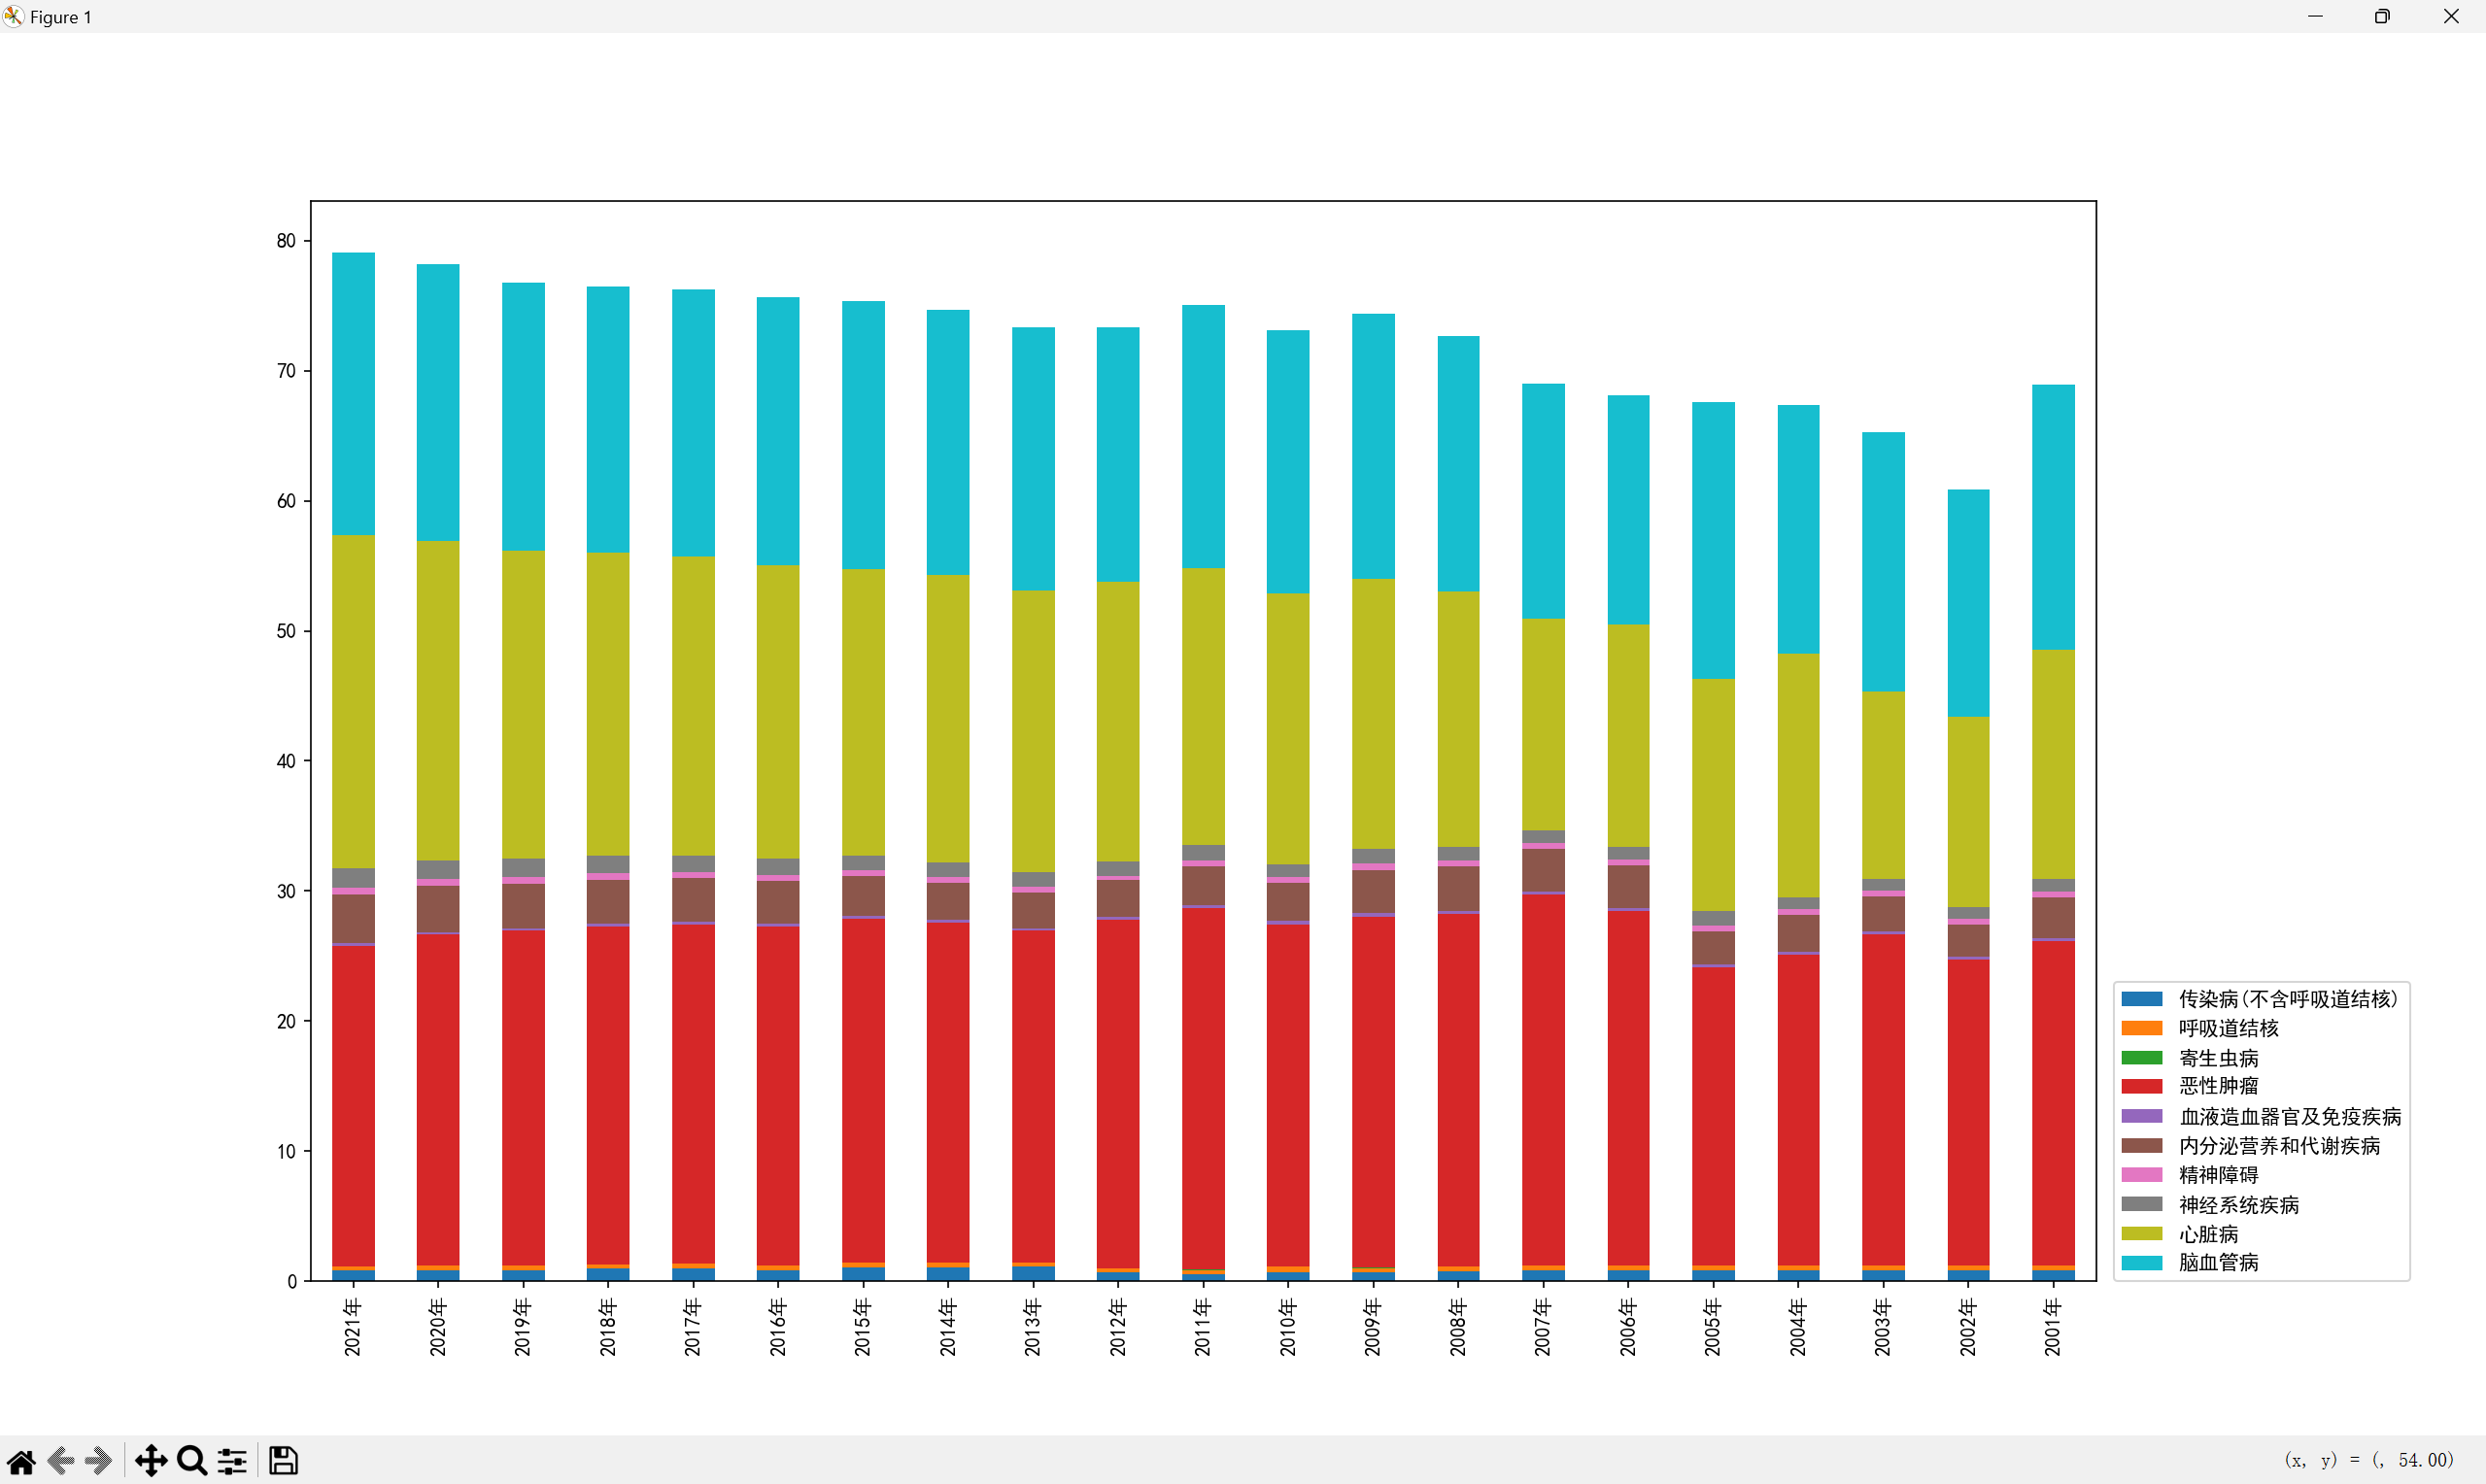
pandas 数据可视化#
plot(data, x, y, kind, legend, ...)
https://pandas.pydata.org/docs/reference/api/pandas.DataFrame.plot.bar.html#pandas.DataFrame.plot.bar
绘制柱状图#
 1
 2
 3
 4
 5
 6
 7
 8
 9
10
11
12
13
14
15
16
17
18
19
20
21
22
23
24
| import pandas as pd
df = pd.read_excel('年度数据.xls', skiprows = 2, skipfooter = 1)
#处理指标数据
df['指标'] = df['指标'].apply(lambda s:s[2:-len('死亡人数占总死亡人数的比重(%)')])
#去除分男女数据
df = df.iloc[:20,:]
#处理空值
df = df.dropna(axis = 1, how = 'all')
#根据需求设置'指标'列为行名
df.set_index('指标', inplace = True)
#填充空值
df = df.apply(lambda x:x.fillna(x.mean()), axis = 1)
print(df.head())
#转置
df = df.T
#绘制柱状图
import matplotlib.pyplot as plt
#设置中文字体
plt.rcParams['font.sans-serif'] = 'SimHei'
df.plot.bar(stacked = True)
plt.show()
|
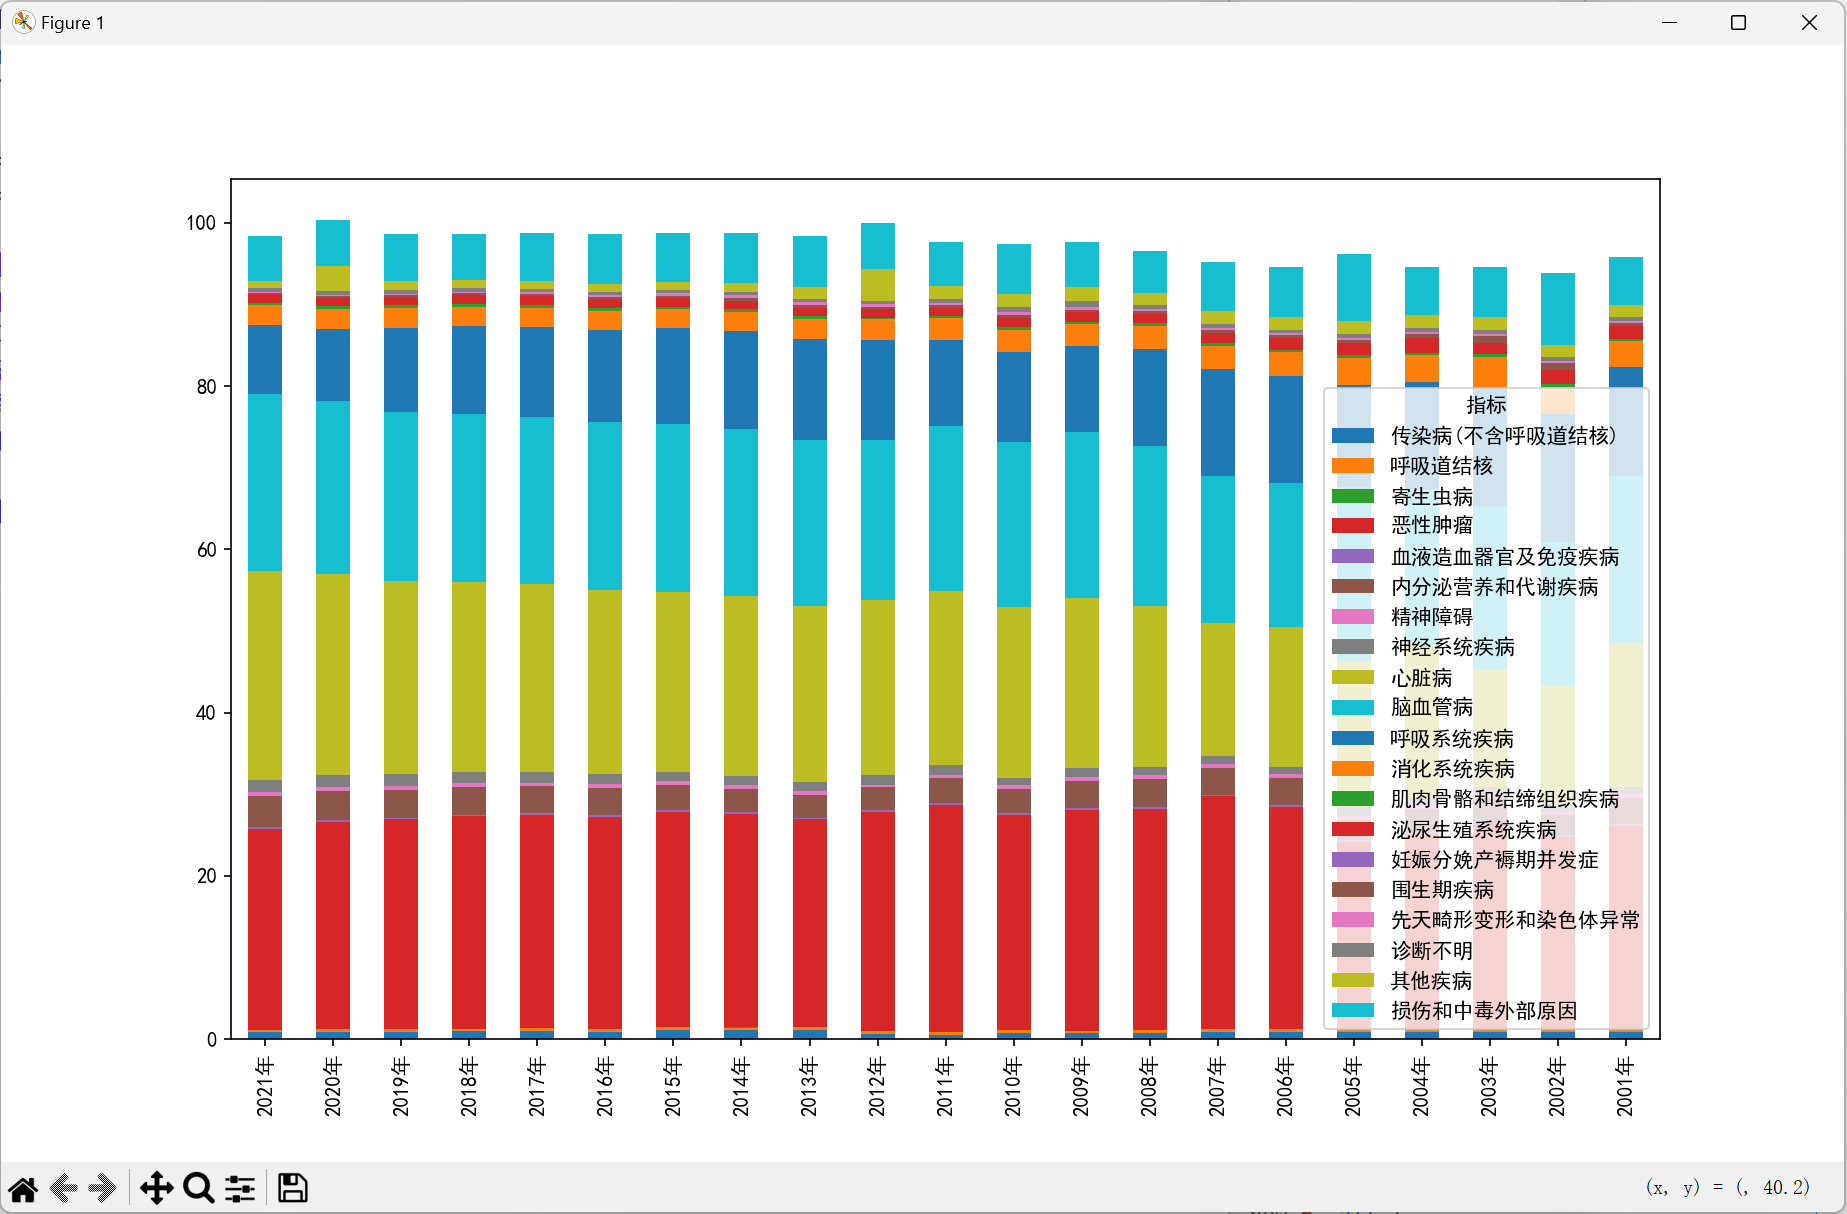
数据的分类与排序#
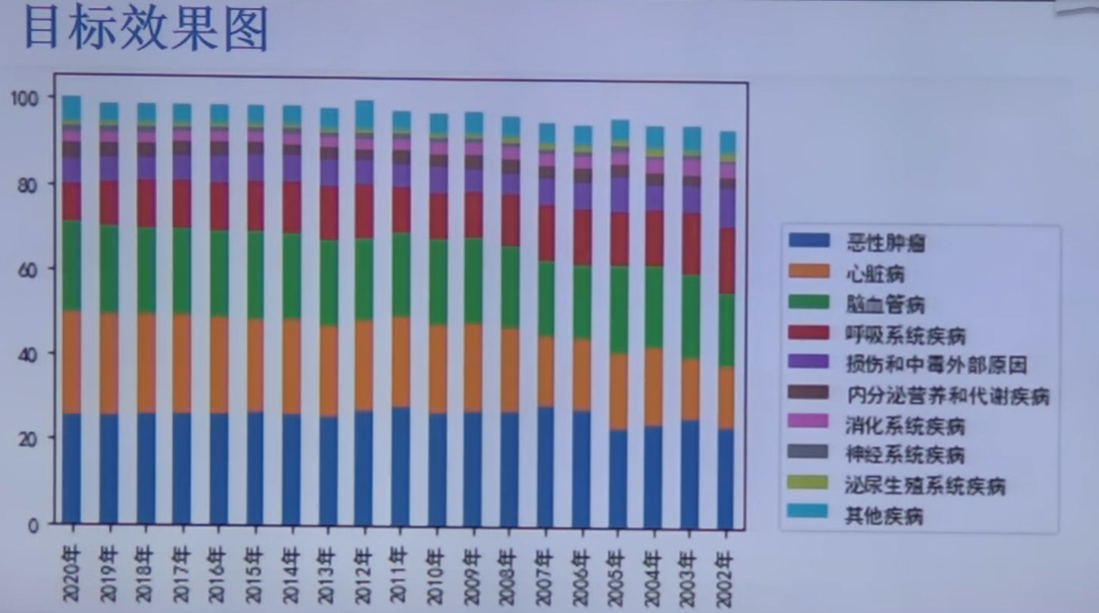
由于分类太多,且部分数据很小很小,所以可以将其归入其他疾病,图中只展示 Top10
完整代码#
 1
 2
 3
 4
 5
 6
 7
 8
 9
10
11
12
13
14
15
16
17
18
19
20
21
22
23
24
25
26
27
28
29
| import pandas as pd
df = pd.read_excel('年度数据.xls', skiprows = 2, skipfooter = 1)
#处理指标数据
df['指标'] = df['指标'].apply(lambda s:s[2:-len('死亡人数占总死亡人数的比重(%)')])
#去除分男女数据
df = df.iloc[:20,:]
#处理空值
df = df.dropna(axis = 1, how = 'all')
#根据需求设置'指标'列为行名
df.set_index('指标', inplace = True)
#填充空值
df = df.apply(lambda x:x.fillna(x.mean()), axis = 1)
print(df.head())
#转置
df = df.T
#绘制柱状图
import matplotlib.pyplot as plt
#设置中文字体
plt.rcParams['font.sans-serif'] = 'SimHei'
df = df.iloc[:,:10]
#df.plot.line()
df.plot.bar(stacked = True)
plt.legend(bbox_to_anchor=(1.01,0),loc=3,borderaxespad=0)
plt.show()
|